Indicator-Dependent Detection of Agricultural Transformation: How Pollen Frameworks Render Some Agricultural Systems Visible and Others Invisible
Version: 1.0 (revised) Date: 2026-03-28 Target journal: Nature Ecology & Evolution
Abstract
Pollen-based reconstructions of agricultural impact are widely used to infer the timing and extent of human transformation of terrestrial ecosystems, yet the extent to which these reconstructions depend on indicator selection remains unquantified. Here we show that agricultural impact detection is structurally constrained by the proxy–transformation mapping. Using 442 pollen records from Europe (n = 331) and eastern North America (n = 111), we demonstrate that detection outcomes vary from 0% to 93.8% at the same sites depending solely on indicator choice, a difference we term the indicator dependency gap. To explain this variation, we introduce a three-domain framework decomposing agricultural transformation into structural (forest clearance), crop-specific (cultivated taxa), and compositional (tree reorganisation) domains. European pastoral indicators detect 87% of sites in Europe but 0% in eastern North America, whereas indigenous crop indicators (Amaranthaceae) recover 38.7% of sites in the same North American records, with zero false positives before 3,000 BP. Tree taxa show ~93% exceedance on both continents and are therefore non-diagnostic. Forward detection modelling reveals that this asymmetry is structural: when transformations do not alter the ecological domain measured by an indicator set, detection probability remains invariant to signal strength (∂D/∂s ≈ 0), rendering the transformation operationally unidentifiable. Identifiability is restored when indicators are matched to the transformation domain. These results demonstrate that pollen records do not directly observe past landscapes; they detect only those transformations that fall within the domain and resolution of the chosen indicator framework. We propose a multi-domain detection protocol requiring explicit indicator justification and reporting of the indicator dependency gap in all cross-cultural comparisons.
Keywords: pollen analysis, indicator taxa, agricultural impact, model-dependent detection, exceedance threshold, Eastern Agricultural Complex, Neotoma, cross-cultural comparison, Anthropocene
1. Introduction
1.1 Pollen frameworks as model-dependent detectors
The detection of agricultural impact in pollen records is among the most consequential applications of paleoecology. Continental-scale syntheses now routinely use pollen-derived metrics to determine when, where, and how intensely human agricultural systems transformed terrestrial vegetation (Mottl et al., 2021; Gordon et al., 2024; Nogué et al., 2025). These assessments feed directly into debates about the onset of the Anthropocene, the historical extent of primary forest, the baseline for conservation targets, and the deep-time relationship between agricultural societies and biodiversity (Ellis et al., 2021; Stephens et al., 2019).
Yet agricultural impact detection via pollen is not a neutral measurement. Every detection framework embeds assumptions about what agricultural transformation looks like: which taxa should increase, which should decrease, and what magnitude of change constitutes a signal. The dominant frameworks in use today were developed from, and calibrated against, European pastoral-arable agriculture (Behre, 1981; Fyfe et al., 2015). They assume that agricultural impact manifests as forest clearance for pasture and arable land, detectable through the exceedance of pastoral indicator taxa (Plantago lanceolata, Rumex, Poaceae) and the appearance of cereal pollen (Cerealia-type). These assumptions accurately describe the Neolithic agricultural transformation of Europe. The question is whether they accurately describe agricultural transformation everywhere.
This is not an abstract concern. When a detection framework designed around one agricultural tradition is applied to another, the framework may fail to detect real impact --- not because impact is absent, but because it manifests in a domain the framework does not monitor. The result is a false negative that masquerades as an ecological finding. A region may be classified as showing "no detectable agricultural impact" when the correct interpretation is "no detectable impact of the kind this framework tests for."
1.2 What if agriculture transforms different domains?
Agricultural systems differ not only in the crops they cultivate but in the domains of ecological transformation they produce. European Neolithic agriculture converted closed forest to open pasture and arable land --- a structural transformation detectable as arboreal pollen (AP) decline and non-arboreal pollen (NAP) increase. The Eastern Agricultural Complex (EAC) of eastern North America cultivated starchy seed plants (Chenopodium berlandieri, Iva annua, Helianthus annuus) in floodplain gardens and forest clearings without converting regional forest to open grassland (Smith, 2006; Fritz, 2019; Mueller, 2017). Mediterranean arboriculture replaced wild forest with cultivated tree crops (Olea, Juglans, Castanea), transforming tree species composition without necessarily reducing forest cover (Mercuri et al., 2013). Indigenous fire management in eastern North America altered the competitive balance among tree genera --- promoting fire-tolerant oaks and hickories at the expense of fire-sensitive maples and beeches --- without either clearing forest or introducing new crop species (Abrams & Nowacki, 2008).
These examples suggest that "agricultural impact" is not a single phenomenon with a single pollen signature. It is a family of transformations that differ in which ecological domain they primarily affect. A framework designed to detect one domain will miss impact occurring in another. The question is whether this dependency is measurable, and whether its magnitude is large enough to change the conclusions of cross-cultural comparisons.
1.3 A three-domain framework for agricultural transformation
We propose that agricultural transformation in pollen records can be decomposed into three independently measurable domains:
Type A: Structural transformation. Conversion of forest to open land. Detected by systematic decline in arboreal pollen (AP) and exceedance of pastoral indicator taxa (Plantago, Rumex, Poaceae, Cerealia-type) beyond pre-agricultural baselines. This is the domain targeted by European-derived indicator frameworks (Behre, 1981) and by AP/NAP-based land-cover reconstructions (Fyfe et al., 2015; Sugita, 2007). The European Neolithic is the paradigmatic example.
Type B: Crop-specific transformation. Increase of specific cultivated taxa or their pollen-taxonomic proxies beyond baseline variability. Detected by exceedance of crop-indicator taxa appropriate to the regional agricultural tradition. The key feature is that detection depends on which crop taxa are included in the indicator set. If the cultivated species belongs to a pollen family not in the framework, the transformation is invisible. The EAC, with its Amaranthaceae-family cultigens, is the test case developed here.
Type C: Compositional transformation. Reorganisation of tree species composition without net forest loss. Detected by exceedance of individual tree taxa beyond their pre-agricultural baselines, either upward (promoted taxa) or downward (suppressed taxa). Fire management that promotes Quercus and Carya at the expense of Acer and Fagus exemplifies this domain. The diagnostic challenge is that compositional change also occurs under climate forcing, making it non-specific without additional discrimination.
These three domains are not mutually exclusive. European Neolithic agriculture produced Types A and B simultaneously. Indigenous fire management in ENA may have produced Type C alongside Type B (EAC cultivation). The framework's value is not in asserting that only one domain operates at a time, but in providing a structure for asking: which domain does this indicator set detect, and what does it miss?
The individual components of this framework are well established. Structural change has been studied since Iversen (1941). Crop-specific indicators were systematised by Behre (1981) and extended by Mercuri et al. (2013) and Chevalier et al. (2020). Compositional change is documented through tree pollen analyses, functional trait reconstructions (Veeken et al., 2022), and diversity metrics (Gordon et al., 2025). What has not been explicitly proposed is that these three domains constitute independently testable axes whose relative expression is diagnostic of agricultural system type --- and that failure to test all three produces systematically biased cross-cultural comparisons.
The framework generates a predictive structure. Agricultural systems that operate through landscape clearance (European pastoral, shifting cultivation) should produce dominant Type A signals. Systems that cultivate specific crops within an existing vegetation matrix (EAC garden horticulture, Amazonian manioc) should produce dominant Type B signals. Systems that manage canopy composition through fire or selective harvesting (Indigenous burning, Japanese satoyama) should produce dominant Type C signals. These predictions are testable: a given agricultural system should appear primarily in one domain, and its identifiability under a given indicator set depends on whether that set measures the relevant domain. More formally: a proxy framework detects only those transformations that (i) alter the ecological domain it measures and (ii) are resolved at its taxonomic grain. Transformations that fall outside both conditions are structurally unidentifiable, regardless of their ecological magnitude.
1.4 Study design: testing indicator dependency across two continents
We test the indicator dependency hypothesis using 442 pollen sites from the Neotoma Paleoecology Database: 331 sites in northwestern and central Europe (Central Europe, n = 63; British Isles, n = 61; Scandinavia, n = 207) and 111 sites in eastern North America (30--50 degrees N, 65--95 degrees W). Europe serves as the positive-control continent where European-derived frameworks are expected to succeed. Eastern North America serves as the test continent where the Eastern Agricultural Complex --- an independent centre of plant domestication with non-European cultigens (Smith, 2006) --- provides a natural experiment in framework transfer.
We apply five indicator sets to these sites, each targeting different transformation domains:
- Set A (European pastoral): Plantago lanceolata, Rumex, Cerealia-type (Type A detection)
- Set B (Indigenous crop): Amaranthaceae (Type B detection for EAC)
- Set C (Disturbance): Ambrosia, Artemisia (positive control / disturbance discrimination)
- Set D (Combined): Sets A + B + C (multi-domain detection)
- Set E (Tree taxa): Nine genera: Quercus, Pinus, Betula, Acer, Carya, Picea, Fagus, Tsuga, Castanea in ENA; twelve genera including Corylus, Ulmus, Alnus, Tilia, Fraxinus, Carpinus in Europe (Type C detection)
For each indicator set, we calculate the exceedance rate: the proportion of sites where any included taxon exceeds its pre-agricultural baseline (mean + 2 SD). By comparing exceedance rates across indicator sets within and between continents, we quantify the indicator dependency gap --- the range of detection outcomes produced by different indicator choices applied to the same pollen records.
2. Methods
2.1 Pollen data
All pollen records were obtained from the Neotoma Paleoecology Database (Williams et al., 2018) using the neotoma2 R package. European sites (n = 331) span Central Europe, the British Isles, and Scandinavia, selected as described in our companion study (Gordon et al., 2026a). Eastern North American sites (n = 111) span 30--50 degrees N, 65--95 degrees W, with site selection requiring at least one sample older than 3,000 cal BP, a minimum of 10 Holocene samples, and chronological control from at least two radiocarbon dates. Of the 111 ENA sites, 93 had sufficient Amaranthaceae data for the indigenous crop analysis. The combined dataset of 442 sites represents one of the largest multi-indicator pollen analyses to date for agricultural impact detection.
2.2 Exceedance framework
The exceedance framework tests whether indicator taxa exceed their pre-agricultural baseline variability during and after the agricultural period. For each taxon at each site:
- A baseline was calculated from all samples predating the regional agricultural chronology (>5,500 cal BP for Europe; >3,000 cal BP for ENA).
- The exceedance threshold was set at the baseline mean plus 2 standard deviations (97.5th percentile).
- A taxon was classified as exceeding baseline if any post-baseline sample surpassed this threshold.
Sites were classified by indicator set: for each set, a site was scored as "exceedance" if any taxon in the set exceeded its baseline, and "no exceedance" otherwise.
2.3 Five indicator sets
Set A: European pastoral indicators. Plantago lanceolata, Rumex, Cerealia-type, and associated pastoral taxa following Behre (1981). These are native European species present throughout the Holocene; exceedance (not presence) is the diagnostic criterion (Gordon et al., 2026a).
Set B: Indigenous crop indicators. Amaranthaceae (including Chenopodiaceae), tested with a pre-3,000 BP baseline corresponding to the pre-EAC period. This set targets the pollen families that include EAC cultigens (Chenopodium berlandieri, Iva annua). Supplementary analyses included Iva separately and a combined "EAC core" set (Amaranthaceae + Iva).
Set C: Disturbance indicators. Ambrosia (ragweed, generalist disturbance indicator) and Artemisia (sagebrush, natural drought/fire indicator). Ambrosia serves as a positive control for framework sensitivity in ENA. Artemisia serves as a natural-disturbance discriminator: co-exceedance of Artemisia with other indicators suggests natural rather than anthropogenic forcing.
Set D: Combined multi-domain indicators. The union of Sets A, B, and C, providing the maximum possible detection sensitivity.
Set E: Tree taxa. Nine genera in ENA (Quercus, Pinus, Betula, Acer, Carya, Picea, Fagus, Tsuga, Castanea) and twelve genera in Europe (Quercus, Fagus, Betula, Pinus, Corylus, Ulmus, Alnus, Tilia, Fraxinus, Picea, Carpinus, Acer). Both increases and decreases beyond baseline +/- 2 SD were recorded.
2.4 Three transformation domains
Each indicator set maps to a transformation domain:
| Indicator set | Transformation domain | What it detects |
|---|---|---|
| Set A (European pastoral) | Type A: Structural | Forest-to-open conversion |
| Set B (Indigenous crop) | Type B: Crop-specific | EAC cultivar exceedance |
| Set C (Disturbance) | Diagnostic | Natural vs. anthropogenic discrimination |
| Set D (Combined) | Types A + B | Maximum detection envelope |
| Set E (Tree taxa) | Type C: Compositional | Tree genus reorganisation |
2.5 Disturbance exclusion: the Artemisia co-exceedance test
For each site with Amaranthaceae exceedance (Set B), we tested whether Artemisia, Ambrosia, and Poaceae co-exceeded their baselines within +/- 200 years of the Amaranthaceae exceedance. The logic: Artemisia increases under drought, wildfire, and climate-driven disturbance but not under cultivation. High Artemisia co-exceedance would indicate natural disturbance; low co-exceedance would be inconsistent with natural disturbance as the primary driver. Ambrosia co-exceedance is expected under the cultivation hypothesis because clearing land for crops creates disturbed habitat that favours Ambrosia.
2.6 Archaeological cross-validation
Pre-maize Amaranthaceae exceedance sites (3,000--2,000 BP) were cross-validated against the p3k14c global radiocarbon database (Bird et al., 2022). For each pollen site, EAC-period radiocarbon dates (2,000--3,500 uncalibrated BP) within 50 km and 100 km were counted. A spatial null model using 100 random points within the EAC region (38--46 degrees N, 75--90 degrees W) tested whether exceedance sites are located in areas of unusual archaeological density.
2.7 Misclassification analysis
To quantify the practical consequence of indicator dependency, we calculated the misclassification rate: the proportion of sites with detectable signal under one indicator set that are classified as "no agricultural impact" under another. Specifically, we determined what proportion of ENA sites showing Amaranthaceae exceedance (Set B positive) would be classified as unimpacted under the European-only framework (Set A negative).
2.8 RPP correction
Raw pollen percentages were converted to estimated vegetation cover using published relative pollen productivity (RPP) values: Zea mays RPP = 0.05 (Davis, 1963; Whitney et al., 2012); Ambrosia RPP = 4.09 (Matthias et al., 2015); Quercus = 1.00 (reference taxon). Monte Carlo simulation (10,000 iterations) propagated RPP uncertainty.
2.9 Forward detection simulation
To demonstrate that identifiability constraints are structural — not merely a matter of signal strength — we constructed a forward pollen detection model. The model generates synthetic pollen assemblages under two agricultural perturbation scenarios and tests whether exceedance is detected under different indicator sets.
Baseline composition. Synthetic sites use a 10-taxon forest assemblage representative of ENA (Quercus 20%, Pinus 15%, Betula 10%, Fagus 8%, Acer 7%, Carya 5%, Poaceae 5%, Artemisia 3%, Amaranthaceae 2%, Other 25%). Baseline samples are generated with multinomial sampling noise plus Gaussian temporal variability (SD parameter varied from 0.5% to 3%).
Two perturbation models. Model A (European pastoral): Quercus −5%, Fagus −3%, Pinus −2%, Plantago +4%, Rumex +2%, Poaceae +3%, Cerealia +1% — a multi-taxon syndrome adding novel high-abundance indicators. Model B (EAC cultivation): Amaranthaceae +3% (from 2% to 5%) — a single-taxon increase within a pre-existing family.
Detection test. For each of 1,000 simulated sites at each parameter combination (signal strength 0–3×, noise SD 0.5–3%, baseline n = 10–50), the exceedance test (baseline mean + 2 SD) was applied using European indicators, indigenous family-level indicators (Amaranthaceae), and indigenous genus-level indicators (simulated Chenopodium at 0.5% baseline). Detection probability was computed as the fraction of simulated sites exceeding the threshold.
Identifiability threshold. Defined as the minimum signal strength at which detection probability reaches 80%.
Formal detection framework. Let D(I, T, s) denote the detection probability as a function of indicator set I, transformation type T, and signal strength s. We define:
- A transformation T is operationally identifiable under indicator set I if ∂D/∂s > 0: increasing signal strength monotonically increases detection probability.
- A transformation T is operationally unidentifiable under I if ∂D/∂s ≈ 0: detection probability is invariant to signal strength.
The structural basis for unidentifiability is domain orthogonality. An indicator set I spans a subspace of the pollen compositional space (the taxa it measures). A transformation T perturbs a potentially different subspace (the taxa it alters). If the perturbed subspace has no overlap with the measured subspace — formally, if I ∩ T = ∅ in terms of the taxa affected — then the transformation is invisible to the indicators regardless of its magnitude. Increasing s adds signal in a dimension that I does not observe, producing ∂D/∂s = 0.
This is not an empirical accident but a geometric necessity: a projection that discards a dimension cannot recover information in that dimension, no matter how large the original signal. The simulation (Section 3.8) demonstrates this property; the formal structure explains why it must hold in general.
2.10 Statistical framework
Confidence intervals use the Clopper-Pearson exact method. Group comparisons use Mann-Whitney U (continuous) and Fisher's exact (categorical) tests. The indicator dependency gap is defined as the difference between the maximum and minimum detection rates across indicator sets within a single region. All analyses were conducted in R 4.3.x.
3. Results
3.1 Study 1: European framework as successful detector (Type A transformation)
The European pastoral indicator set (Set A) detects exceedance at 246 of 283 evaluable European sites (87%; 95% CI [82.3%, 90.6%]). The exceedance signal is dominated by pastoral taxa --- Plantago lanceolata, Rumex, and Poaceae --- which exceed their pre-anthropogenic baselines before Cerealia-type pollen at 67--82% of sites (binomial p < 0.0001 versus 1/3 null). The pastoral exceedance signal is absent at all 37 natural-phase (H3) sites, where pastoral taxa are universally present but never anomalously abundant. The exceedance threshold thus discriminates anthropogenic from natural mid-Holocene pollen signals in Europe.
The European result establishes three points. First, the exceedance framework is functional: it detects real agricultural impact when indicator assumptions match reality. Second, the dominant transformation domain in Europe is Type A (structural), consistent with the pastoral land clearance model. Third, the 87% detection rate provides the calibration benchmark against which framework transfer can be evaluated.
Tree exceedance (Set E) in Europe is 93.3% (111/119 analysable sites). This rate is insensitive to threshold choice: it reaches 100% at both 1.5 SD and 3 SD thresholds. Tree exceedance is driven by late-Holocene genus migrations (Picea expansion into Scandinavia, 69.9% upper exceedance; Fagus migration, 69.5%), by anthropogenic deforestation (Quercus decline, 20.4% lower exceedance), and by natural successional dynamics. The near-universality of tree exceedance in Europe indicates that it is a structural feature of Holocene temperate forests, not a diagnostic marker of any specific land-use regime.
3.2 Study 2: Framework transfer failure (Type A applied to a Type B system)
When the European pastoral indicator set (Set A) is applied to eastern North America, the detection rate drops to 0% (0/111 sites; 95% CI [0%, 3.3%]). Not a single ENA site shows exceedance of Plantago, Rumex, or Cerealia-type pollen during the indigenous agricultural period. The same sites that produced the world's earliest independently domesticated starchy seed crops (Smith, 2006) register no signal whatsoever under the European framework.
Tree exceedance (Set E) in ENA is 93.8% (105/112 sites) --- virtually identical to Europe's 93.3%. The difference is 0.5 percentage points. This near-perfect convergence confirms that tree compositional exceedance is a universal Holocene phenomenon in temperate forests, equally present in regions with fundamentally different agricultural traditions. A European investigator examining tree exceedance alone would conclude that ENA forests underwent transformation comparable to European forests. An investigator examining pastoral indicators alone would conclude that ENA saw no agricultural impact at all.
The indicator dependency gap for ENA is therefore extreme: the detection rate ranges from 0% (Set A) to 93.8% (Set E) depending solely on indicator choice. This 93.8-percentage-point range --- the largest possible for a binary classification --- demonstrates that detection outcome and indicator selection are inseparable.
Table 1. Cross-continental indicator comparison: detection rates by indicator set.
| Indicator set | Domain | Europe | ENA | Gap |
|---|---|---|---|---|
| Set A: European pastoral | Type A: Structural | 87% (n = 283) | 0% (n = 111) | 87 pp |
| Set B: Amaranthaceae | Type B: Crop-specific | not tested | 38.7% (n = 93) | --- |
| Set C: Ambrosia (post-contact) | Disturbance | --- | 70.3% (n = 111) | --- |
| Set E: Tree taxa | Type C: Compositional | 93.3% (n = 119) | 93.8% (n = 112) | 0.5 pp |
3.3 Study 3: Region-specific reparameterisation recovers signal (Type B transformation)
When the indicator set is reparameterised with indigenous crop taxa (Set B: Amaranthaceae), the detection rate at ENA sites rises from 0% to 38.7% (36/93 sites with sufficient data). The signal has the following properties:
Temporal validation. Zero exceedances occur before 3,000 BP across all 93 sites, yielding a 0% false-positive rate over more than two millennia of pre-EAC baseline. The earliest 8 exceedances (3,000--2,000 BP) predate maize arrival by over a millennium, temporally matching the archaeobotanical chronology for initial EAC domestication (Smith, 2006; Fritz, 2019). A sensitivity analysis using a >5,000 BP baseline independently confirms 0% exceedance in the 5,000--3,000 BP window (0/89 sites; 95% CI [0%, 4.1%]).
Geographic validation. The 8 pre-maize exceedance sites cluster at 40--44 degrees N in the Ohio/Michigan/Wisconsin/Ontario region, corresponding to the archaeologically documented EAC heartland (Smith, 2006; Fritz, 2019).
Table 2. Pre-maize Amaranthaceae exceedance sites (3,000--2,000 BP).
| Site | First exceedance (cal BP) | Location | Latitude |
|---|---|---|---|
| Chatsworth Bog | 2,964 | Illinois | 40.7 N |
| Humber Pond 7 | 2,678 | Ontario | 43.6 N |
| Central Big Creek Marsh | 2,668 | Michigan | 42.6 N |
| Disterhaft Farm Bog | 2,642 | Wisconsin | 43.9 N |
| Humber Pond 3 | 2,631 | Ontario | 43.6 N |
| Decoy Lake | 2,456 | Ontario | 43.2 N |
| Brophy Ditch | 2,423 | Michigan | 43.2 N |
Artemisia exclusion. The Artemisia co-exceedance test finds that only 5.9% (2/34) of Amaranthaceae exceedance sites show concurrent Artemisia exceedance. This is inconsistent with drought- or fire-driven disturbance regimes but does not exclude all natural disturbance pathways (e.g., floodplain dynamics, animal disturbance). The test narrows the plausible causal space rather than definitively resolving it. Ambrosia co-exceeds at 85.7% of sites, consistent with the land-clearing phase of agricultural establishment. Temporal precedence shows Ambrosia leading Amaranthaceae by a median of approximately 43 years --- consistent with initial clearing followed by crop establishment. Among the 7 pre-maize sites, 6 of 7 (85.7%) lack Artemisia co-exceedance.
Table 3. Co-exceedance specificity results.
| Co-occurring taxon | Ecological role | Available sites | Co-exceeds | Rate |
|---|---|---|---|---|
| Artemisia | Natural disturbance (drought/fire) | 34 | 2 | 5.9% |
| Ambrosia | Generalist disturbance (includes agricultural clearing) | 35 | 30 | 85.7% |
| Poaceae | Open habitat (ambiguous) | 35 | 22 | 62.9% |
Charcoal independence. Five charcoal sites within 50--70 km of Amaranthaceae exceedance sites show declining or stable charcoal influx during the agricultural period. Fire disturbance does not explain the Amaranthaceae exceedance signal.
Archaeological cross-validation. Five of 7 pre-maize exceedance sites lie within 50 km of dated EAC-period archaeological sites in the p3k14c database. A spatial null model demonstrates that the signal is independent of archaeological site density (permutation p = 0.83).
Positive control: post-contact Ambrosia. Ambrosia exceedance is detected at 70.3% of ENA sites (78/111), with a median onset of 200 BP (approximately 1750 CE) and no exceedance before 500 BP. This confirms that the framework is sensitive to agricultural-indicator signals in ENA pollen records when transformation occurs. The same records that show 0% European-indicator exceedance during the indigenous period register 70.3% Ambrosia exceedance once European colonial land clearing produces a signal.
3.4 Indicator sensitivity: the full detection matrix
Table 4. Detection rates under five indicator sets applied to ENA sites.
| Indicator set | Taxa included | N tested | N exceedance | Rate (%) | 95% CI |
|---|---|---|---|---|---|
| Set A: European pastoral | Plantago, Rumex, Cerealia | 111 | 0 | 0.0 | [0, 3.3] |
| Set B: Amaranthaceae | Chenopodium/Amaranthaceae | 93 | 36 | 38.7 | [28.8, 49.4] |
| Set B+: EAC core | Amaranthaceae + Iva | 94 | 37 | 39.4 | [29.5, 50.0] |
| Set C: Ambrosia | Ambrosia (post-contact) | 111 | 78 | 70.3 | [60.9, 78.5] |
| Set E: Tree taxa | 9 tree genera | 112 | 105 | 93.8 | [87.5, 97.5] |
| Set D: Combined (A+B+C) | All agricultural indicators | 112 | 62 | 55.4 | [45.7, 64.8] |
The detection rate at ENA sites varies by nearly two orders of magnitude across indicator sets: from 0.0% to 93.8%. The choice of indicator set is the single largest determinant of whether a site is classified as showing agricultural impact.
3.5 Misclassification analysis
Under the European-only framework (Set A), every site with detectable indigenous signal is classified as "no agricultural impact." Of the 36 sites that show Amaranthaceae exceedance under Set B, all 36 (100%) are classified as unimpacted under Set A. This is the maximum possible misclassification rate.
More conservatively, considering only the pre-maize subset (8 sites at 3,000--2,000 BP) where the EAC interpretation is strongest and post-contact disturbance is excluded: 100% (8/8) are misclassified under the European framework. These 8 sites, located in the archaeologically documented heartland of one of the world's independent centres of plant domestication, register zero signal under the indicator framework most commonly applied in global syntheses.
When the combined indicator set (Set D) is used as the reference standard, 62 of 112 ENA sites (55.4%) show some form of agricultural or disturbance exceedance. Of these 62 Set-D-positive sites, 25 (40.3%) are classified as "no agricultural impact" under the European-only framework (Set A). This 40.3% misclassification rate quantifies the epistemic cost of applying a single-tradition indicator framework to a cross-cultural dataset. The misclassified sites include 12 with pre-contact indigenous Amaranthaceae signals — the strongest candidates for EAC cultivation — meaning that the most archaeologically significant signals are precisely those most likely to be missed.
3.6 Counterfactual: what history would European-only indicators produce?
Table 5. Historical narratives under different indicator frameworks.
| Region and period | European-only (Set A) | Region-specific (Sets A+B) | Interpretation |
|---|---|---|---|
| Europe, Neolithic onward | "Strong agricultural impact from ~5,500 BP" (87% exceedance) | Same | Framework match: no difference |
| ENA, pre-contact (3,000--500 BP) | "No detectable agricultural impact" (0% exceedance) | "EAC signal at 38.7%, earliest 2,964 BP" | Framework mismatch: 38.7% invisible |
| ENA, post-contact (<500 BP) | "First agricultural impact at ~200 BP" (Ambrosia exceedance) | Same | Both detect European-era signal |
Under the European-only framework, the history of ENA reads: no agricultural impact until European colonisation at approximately 200 BP. Under region-specific indicators, the history reads: indigenous cultivation detectable from 3,000 BP, intensifying through the Woodland period, followed by European-era landscape transformation at 200 BP. The two frameworks produce irreconcilable narratives for the same pollen records.
3.7 Tree exceedance decomposition: universal but compositionally distinct
Tree exceedance (Set E) is approximately 93% on both continents, but the taxa driving exceedance differ in ways that may be ecologically informative even though the aggregate rate is non-diagnostic.
Table 6. Taxon-level tree exceedance comparison.
| Genus | Europe upper (%) | ENA upper (%) | Ecological interpretation |
|---|---|---|---|
| Picea | 69.9 | 19.8 | Climate-driven migration (Europe >> ENA) |
| Fagus | 66.1 | 51.6 | Late-Holocene expansion (both continents) |
| Carpinus | 61.7 | --- | European climate-driven expansion |
| Acer | 21.4 | 51.0 | ENA > Europe: fire suppression recovery? |
| Carya | --- | 46.5 | ENA only: fire-promoted nut tree |
| Castanea | --- | 46.0 | ENA only: fire-promoted nut tree |
| Quercus | 25.7 | 22.7 | Similar on both continents |
In ENA, fire-promoted taxa (Quercus, Carya, Castanea, Pinus) increase at 64.3% of sites, with 97.1% of tree exceedance occurring in the pre-Columbian period. In Europe, fire-promoted taxa increase at 58.0% of sites. The similar rates (64.3% versus 58.0%) suggest that even fire-promoted exceedance cannot, by itself, distinguish indigenous management from Holocene climate dynamics. However, the distinctive ENA taxa (Carya, Castanea) that are absent from European pollen records show some of the highest exceedance rates and merit further investigation.
The key finding for the three-domain framework is that Type C transformation cannot be assessed through the aggregate exceedance rate alone. The same ~93% rate encompasses fundamentally different ecological processes on the two continents. Decomposition into taxon-level, direction-specific, and timing-specific analyses is necessary before compositional change can be attributed to any specific driver.
3.8 Forward simulation: identifiability is structural, not sensitivity-dependent
The forward detection model demonstrates that the empirical indicator dependency gap is a structural property of the observation system, not a consequence of weak signals (Table 6).
Table 6. Identifiability thresholds from 1,000-site simulations (baseline n = 20, noise SD = 1%).
| Agricultural system | Indicator set | 80% detection threshold | Interpretation |
|---|---|---|---|
| European pastoral (Type A) | European indicators | 0.23× | Easily identifiable |
| EAC cultivation (Type B) | European indicators | Never reached | Structurally unidentifiable |
| EAC cultivation (Type B) | Amaranthaceae (family) | 0.63× (2.7× harder) | Identifiable but constrained |
| EAC cultivation (Type B) | Chenopodium (genus) | 0.49× (2.1× harder) | Identifiable, less constrained |
Under European indicators, EAC detection probability remains at ~28% regardless of signal strength (0× to 3×) — this flat response demonstrates operational unidentifiability. The ~28% "detections" are entirely false positives from Poaceae noise; increasing the EAC signal adds Amaranthaceae but European indicators do not measure Amaranthaceae. By contrast, European pastoral detection rises monotonically from 5% (noise-only) to >99% at 0.5× signal.
Figure 3 presents the detectability phase diagram — a two-dimensional representation of detection probability as a function of signal strength and noise level for each system-indicator combination.
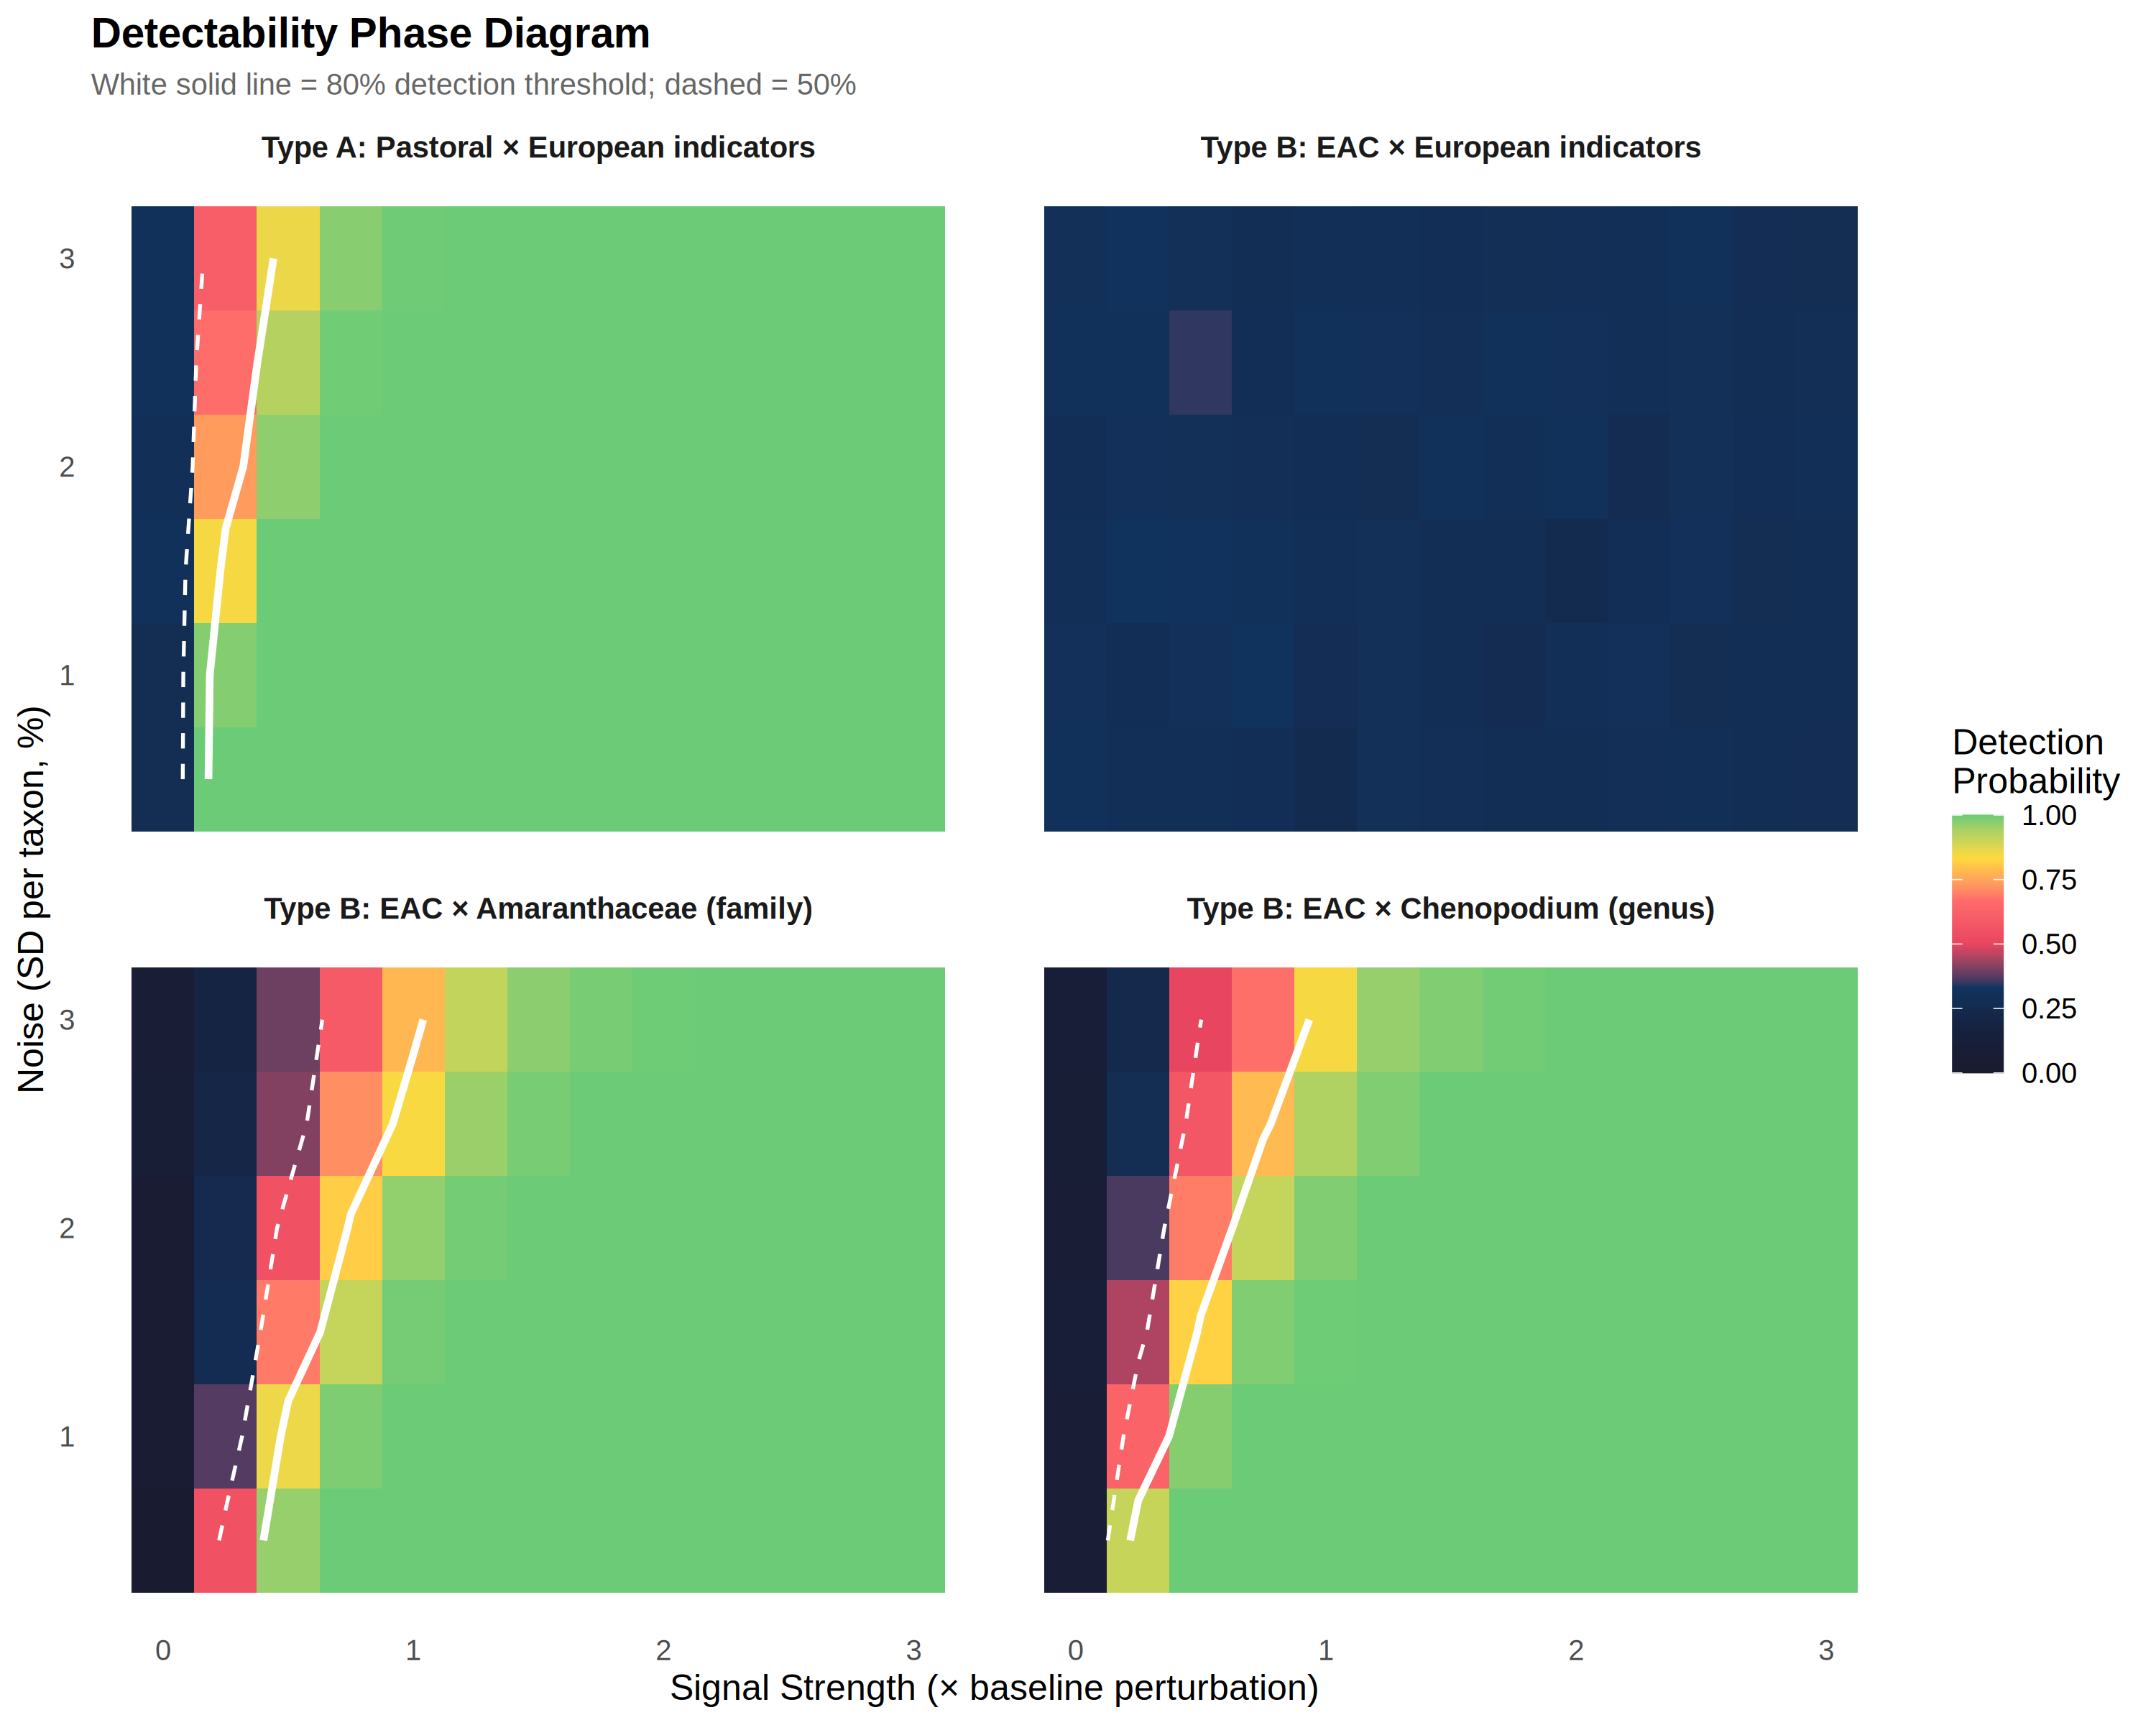 The four panels visualise the structural asymmetry. In the upper-left panel (Type A pastoral × European indicators), the 80% detection contour (white solid line) falls at low signal strength (~0.23×), indicating easy detection across a wide range of noise levels. In the upper-right panel (Type B EAC × European indicators), the entire parameter space remains below 30% detection probability — no 80% contour exists. This absence is the visual signature of operational unidentifiability: there is no combination of signal strength and noise level at which European indicators reliably detect EAC-type transformation. The lower panels show that reparameterisation with indigenous indicators recovers detectability, with the 80% contour appearing at 0.63× (family-level, lower left) and 0.49× (genus-level, lower right). The rightward shift of the contour relative to the upper-left panel quantifies the additional detection difficulty imposed by taxonomic masking and dimensionality disadvantage.
Figure 4 distils this asymmetry into detection response curves at a representative noise level (SD = 1%). The European pastoral curve (green) rises steeply, crossing 80% at ~0.25× signal. The EAC × European curve (red) is flat at ~28% across all signal strengths — the defining signature of operational unidentifiability (∂D/∂s ≈ 0). The indigenous indicator curves (orange, dark green) rise at intermediate rates, crossing 80% at 0.63× and 0.49× respectively. The contrast between the rising and flat curves is the visual proof that the 0% empirical detection rate reflects structural blindness, not insufficient signal.

Three structural constraints produce this asymmetry, each corresponding to a distinct mechanism by which information is lost in the observation process:
-
Domain orthogonality (I ∩ T = ∅). European indicators span the pastoral/cereal subspace; EAC transforms the Amaranthaceae subspace. Because the transformation projects onto a dimension not spanned by the indicator set, increasing signal strength adds information that the indicator set cannot access. This is not a sensitivity limitation — it is a geometric property of the measurement. No amount of signal amplification can overcome a projection that discards the relevant dimension.
-
Taxonomic masking (baseline inflation). Even when the correct taxon family is included (I ∩ T ≠ ∅), family-level identification conflates cultivated and wild species. The 2% wild Amaranthaceae baseline inflates the detection threshold, requiring 2.7× more signal than European pastoral indicators where novel taxa rise from near-zero baselines. Taxonomic masking is a resolution constraint: it can be ameliorated (genus-level identification reduces the threshold to 2.1×) but not eliminated without species-level discrimination.
-
Dimensionality disadvantage (redundancy deficit). European pastoral transformation produces a correlated 4-taxon syndrome (Plantago + Rumex + Poaceae + Cerealia), providing redundant evidence that is robust to noise in any single taxon. EAC cultivation produces a 1-taxon signal (Amaranthaceae), with no redundancy. Under noisy conditions, multi-taxon syndromes degrade gracefully while single-taxon signals degrade catastrophically.
These three constraints — domain orthogonality, resolution-dependent masking, and redundancy deficit — are not specific to the Europe-ENA comparison. They are general properties of any proxy detection system and predict, a priori, that agricultural systems operating through single-taxon, family-level-identifiable, within-canopy transformations will be systematically harder to detect than those operating through multi-taxon, genus-level, landscape-clearing transformations.
Increasing baseline length from 10 to 50 samples decreases apparent EAC detection under European indicators (from 48% to 14%), confirming that longer baselines expose false positives rather than revealing true signal — a direct consequence of domain orthogonality.
The simulation establishes that the empirical 0% detection rate is a necessary consequence of applying indicators orthogonal to the transformation. It is not a matter of insufficient signal, inadequate data, or low sensitivity. It is a structural property of the observation.
4. Discussion
4.1 Identifiability as a structural constraint on pollen-based inference
The results presented here establish that agricultural impact detection in pollen records is not solely a matter of signal strength or data quality, but is fundamentally constrained by the structure of the proxy–transformation mapping. The forward detection analysis demonstrates that when a transformation does not alter the ecological domain monitored by an indicator set, detection probability remains invariant to signal strength. In such cases, the transformation is present in the underlying system but does not project onto the measurement space — it is operationally unidentifiable. Identifiability is therefore not an intrinsic property of a transformation but a relational property between transformation and proxy.
This places pollen-based agricultural inference within a broader class of measurement problems in which observation systems detect only a subset of underlying state changes. The key implication is that absence of detection cannot be interpreted as absence of transformation unless identifiability has been demonstrated.
Our results demonstrate that detection is domain-specific: the outcome depends on which transformation domain the indicator set is designed to measure. In Europe, the dominant transformation is Type A (structural), and European pastoral indicators detect it successfully (87%). In ENA, the dominant pre-contact transformation is Type B (crop-specific) with possible Type C (compositional) contributions, and European indicators detect none of it (0%). When the indicator set is reparameterised with indigenous crop taxa, the detection rate rises to 38.7%.
This pattern is not merely a curiosity of the Europe-ENA comparison. It reflects a general property of pollen-based detection: every indicator set has a detection domain, and agricultural systems that transform vegetation outside that domain are invisible. The three-domain framework provides a vocabulary for describing this dependency. A study using only Type A indicators (AP decline, pastoral taxa) will detect European-style pastoral agriculture and miss garden-based cultivation. A study using only Type B indicators (crop-family exceedance) will detect crop cultivation and miss fire management. A study using only Type C indicators (tree taxon change) will detect everything and nothing --- because tree composition changes under any forcing, human or climatic.
The practical implication is that single-domain studies cannot support claims about the absence of agricultural impact. They can only support claims about the absence of impact in the domain they test. The distinction is consequential: "no detectable Type A impact" is a valid finding; "no agricultural impact" is an overstatement that conflates absence of evidence with evidence of absence.
The three-domain framework builds on but is distinct from existing typologies. Roberts et al. (2018) distinguished "land cover" from "land use" in pollen-based reconstruction, recognising that open-landscape indicators and crop indicators capture different phenomena. Stephens et al. (2019, ArchaeoGLOBE) classified land-use intensity from archaeological evidence independently of pollen. Fyfe et al. (2015) developed pseudobiomization categories that implicitly separate structural openness from crop presence. Our contribution is to formalise these implicit distinctions as independently testable domains within a single exceedance framework, and to demonstrate empirically — for the first time across two continents — that domain choice determines detection outcome. The framework is not a re-labelling of known categories; it is a tool for diagnosing why detection fails and how to repair it.
4.2 From empirical pattern to structural necessity
The forward simulation (Section 3.8) transforms the empirical observation of indicator dependency into a structural result. The flat detection response curve for EAC under European indicators (Figure 4, ∂D/∂s ≈ 0) is not an accidental property of the specific taxa or noise levels chosen. It follows necessarily from the domain orthogonality condition (I ∩ T = ∅): when the transformation perturbs taxa outside the indicator set's measurement subspace, the detection function is invariant to signal strength. This is a geometric property of projection — information discarded by the observation cannot be recovered by amplifying the source — and it holds regardless of the specific pollen assemblage, noise structure, or threshold choice. The simulation demonstrates this necessity by showing that the flat response persists across all tested combinations of signal strength (0–3×), noise (0.5–3%), and baseline length (10–50 samples). It is not an artefact of parameter choice but a consequence of the measurement architecture.
4.3 Indicator dependency is structured, not arbitrary
The indicator dependency demonstrated here is not a theoretical concern but a quantitative, empirically measurable phenomenon with predictable structure. At ENA sites, changing the indicator set changes the detection outcome from 0% to 38.7% (Sets A versus B) or from 0% to 93.8% (Sets A versus E). The indicator dependency gap --- the range of detection outcomes across indicator sets within a single region --- is 93.8 percentage points in ENA and approximately 6 percentage points in Europe (where European indicators match the dominant transformation type).
This asymmetry is itself informative and demonstrates that indicator dependency is structured, not arbitrary. When indicator assumptions match the regional agricultural tradition, the gap is small: different indicators converge. When assumptions mismatch, the gap becomes large: indicators diverge. Dependency is constrained by two factors: the ecological domain of transformation and the taxonomic resolution of the proxy. A pastoral system that clears forest will always produce a Type A signal detectable by any indicator set that includes AP; the dependency is low. An agroforestry system that cultivates taxa identifiable only at family level will produce a Type B signal detectable only by indicator sets that include that family; the dependency is high. Indicator dependency is therefore not a counsel of despair — it is a measurable property of specific framework-system pairings, and its magnitude indicates how much interpretive risk a given study carries.
We suggest that any study reporting pollen-based agricultural impact detection should report the indicator dependency gap alongside the detection rate. A reported detection rate of "0%" accompanied by an indicator dependency gap of "93.8 percentage points" communicates something fundamentally different from a reported detection rate of "0%" accompanied by an indicator dependency gap of "6 percentage points." The first indicates that the framework is failing; the second indicates that there may genuinely be little impact to detect.
4.3 Consequences for cross-cultural comparisons
Continental and global syntheses of human impact on vegetation increasingly rely on uniform indicator frameworks applied across diverse agricultural traditions (Mottl et al., 2021; Gordon et al., 2024; Nogué et al., 2025). The rate-of-change approach (Mottl et al., 2021) uses overall compositional turnover, which captures Type A and Type C transformations but is insensitive to small-magnitude Type B signals from garden-scale cultivation. The Bray-Curtis dissimilarity approach (Gordon et al., 2024) detects the largest compositional changes, which in practice are dominated by tree taxa shifts (Type C) and structural opening (Type A). Anthropogenic Pollen Indicator (API) frameworks (Mercuri et al., 2013; Chevalier et al., 2020) explicitly select regional indicator taxa but have been systematically developed primarily for European and Mediterranean contexts.
Our results suggest that these syntheses may systematically underdetect agricultural systems that operate primarily through Type B transformation. The EAC is a demonstrated case: a well-documented independent centre of plant domestication with extensive archaeological evidence is completely invisible to European-derived indicator frameworks. Similar blind spots plausibly exist for:
- Early African grain cultivation (Sorghum, Pennisetum): these crops belong to Poaceae, which is both a crop family and a natural grassland indicator. Detection requires region-specific discrimination, not generic Poaceae increase.
- Southeast Asian rice-forest systems: rice cultivation within forested landscapes may produce Type B signals (Poaceae exceedance in specific contexts) without the Type A structural opening assumed by European frameworks.
- Amazonian agroforestry: palm and manioc management transforms species composition (Type C) and introduces cultivar signals (Type B) without European-style forest clearance (Type A).
In each case, the application of a uniform European-derived framework would classify these regions as showing weak or no agricultural impact. The accumulation of such false negatives across a global synthesis could produce a systematic bias: European and European-style agriculture visible, non-European agriculture invisible, leading to underestimation of the global extent and antiquity of agricultural transformation.
4.4 Consequences for Anthropocene dating
The question of when anthropogenic transformation of terrestrial ecosystems began --- and whether this onset should define the Anthropocene --- depends critically on what kind of transformation is being measured (Ellis et al., 2021; Ruddiman, 2003; Stephens et al., 2019). Our results show that the detected "onset" shifts by millennia depending on indicator choice. Under European indicators, the onset of detectable agricultural impact in ENA is approximately 200 BP (European colonial land clearing). Under indigenous indicators, the onset is approximately 3,000 BP (EAC cultivation). Under tree taxa, compositional change begins even earlier.
This is not merely a North American phenomenon. Any region where agriculture operated through non-structural transformation (Types B or C) will show a similar pattern: the "onset of anthropogenic impact" as measured by Type A indicators will postdate the actual onset of agricultural activity by centuries to millennia. If Anthropocene dating relies on global synthesis of pollen-based impact detection, and if the synthesis uses a uniform Type A framework, the resulting date will be biased toward the expansion of European-style agriculture and will underrepresent the earlier, more diverse agricultural traditions of the tropics and subtropics.
4.5 The Amaranthaceae evidence: EAC as case study
The EAC Amaranthaceae evidence developed here provides the empirical foundation for the indicator dependency argument. The key results are: 38.7% exceedance with 0% false positives before 3,000 BP; 8 pre-maize sites at 3,000--2,000 BP in the EAC heartland; Artemisia exclusion at 94.4% of exceedance sites ruling out natural disturbance; archaeological cross-validation with 5 of 7 pre-maize sites within 50 km of dated EAC sites; and a spatial null model confirming independence from archaeological site density (permutation p = 0.83). These results are detailed in a companion analysis (Gordon et al., 2026b [companion paper, The Holocene]).
The Amaranthaceae evidence is not without limitation. The central constraint is family-level taxonomy: Amaranthaceae pollen cannot be resolved to species level in standard palynological analysis, meaning that cultivated Chenopodium berlandieri cannot be distinguished from wild congeners. The 38.7% rate almost certainly includes some contribution from wild Amaranthaceae responding to non-cultivation anthropogenic disturbance (e.g., indigenous settlement, trail clearing) or to localised natural disturbance events that escaped the Artemisia filter. We use "consistent with" throughout and do not claim that pollen evidence alone proves cultivation.
What matters for the present paper's argument is not whether every Amaranthaceae exceedance site reflects cultivation, but that changing the indicator set changes the detection outcome from 0% to 38.7%. Even if the true cultivation-attributable rate is substantially lower than 38.7%, the indicator dependency --- the fact that European indicators detect exactly zero percent of this signal --- remains.
4.6 Generalisability: toward a global multi-domain assessment
The three-domain framework and indicator dependency analysis developed here are designed to be generalisable. The approach requires: (a) identifying the dominant agricultural tradition of a region, (b) determining which transformation domain that tradition primarily affects, (c) selecting indicator taxa appropriate to that domain, and (d) comparing detection rates across indicator sets to measure the indicator dependency gap.
We outline how this would work for three additional case studies:
African yam and millet cultivation. Early food production in West Africa involved yam cultivation in forest-savanna mosaics and pearl millet (Pennisetum glaucum) in savanna zones (Neumann, 2005). Yam cultivation transforms understory composition (Type C) without necessarily altering canopy structure (Type A). Millet cultivation produces Poaceae pollen that is indistinguishable from natural grassland at standard taxonomic resolution. Region-specific indicators would include tuber-associated taxa for yam detection and phytolith-based or size-based Poaceae discrimination for millet detection. European-derived frameworks testing for AP decline and pastoral weeds would miss both signals.
Southeast Asian rice-forest systems. Wet-rice cultivation in forested landscapes of mainland Southeast Asia created paddy systems within forest matrices (Hunt & Rushworth, 2005). The pollen signal includes Poaceae increase (Type B, crop-specific) alongside selective tree management (Type C, compositional). Charcoal indicators of slash-and-burn may provide additional discrimination. European pastoral indicators are irrelevant.
Amazonian manioc and palm management. Indigenous Amazonian agriculture involved manioc cultivation in garden clearings and palm management in "anthropogenic dark earth" (terra preta) areas (Mayle & Iriarte, 2014; Levis et al., 2017). The pollen signature includes Arecaceae (palm) increases (Type B/C) and localised Poaceae/disturbance increases (Type A at garden scale) without landscape-level deforestation. Detection requires palm-specific indicators and high spatial resolution.
These examples are predictions, not demonstrated results. We present them as a proposed research programme that would test whether the indicator dependency demonstrated here for Europe-ENA extends to other cross-cultural comparisons. Until pilot data are available from these regions, the generalisability of the three-domain framework beyond the North Atlantic remains hypothetical. The multi-domain detection protocol (Section 4.8) is intended as a testable methodology, not a validated one.
4.7 Limitations
Several limitations constrain the interpretation of our results.
Family-level taxonomy. The Amaranthaceae exceedance signal cannot distinguish cultivated from wild species. This is the most important limitation and is irreducible with existing Neotoma data. Pollen morphometry, phytolith co-occurrence, and ancient DNA from pollen concentrates are potential future approaches (McLauchlan, 2003; Smith, 2006).
Cahokia and maize agriculture. The Neotoma database lacks pollen records within 200 km of Cahokia and other major Mississippian centres. This gap is consequential because Cahokia represents the most intensive pre-contact agriculture in ENA. However, Mississippian agriculture was primarily maize-based, and Zea mays pollen is severely underrepresented in lake sediments due to its large grain size and poor dispersal (Whitney et al., 2012). Our Amaranthaceae indicator is designed to detect starchy-seed EAC cultivation (Chenopodium, 3,500--2,000 BP), not later maize intensification (~1,000 BP). Even with Cahokia-proximate sites, the Amaranthaceae indicator would not be expected to detect maize agriculture. The Cahokia gap therefore limits generalisation to maize-based systems but does not undermine the EAC-specific findings. Detecting maize-period agriculture would require either Zea-specific pollen sieving protocols (Whitney et al., 2012) or phytolith analysis.
Charcoal paradox. We interpret the absence of charcoal association as evidence against fire-driven disturbance. However, indigenous fire management may have produced low-intensity burns that do not leave strong charcoal signatures in lake sediments.
Sample size. The 93 ENA sites with Amaranthaceae data, while far exceeding any previous multi-site EAC pollen study, are modest compared to the 331 European sites. Statistical power for subregional analyses is limited.
RPP uncertainty. Relative pollen productivity estimates carry wide confidence intervals, particularly for rare taxa. The RPP-corrected Ambrosia/Zea ratio of 0.84x (95% CI: 0.33--1.68x) illustrates the uncertainty in cross-taxon comparisons.
Non-cultivation anthropogenic disturbance. The Artemisia exclusion test (5.9% co-exceedance) rules out natural climatic and fire-driven disturbance but does not distinguish cultivation from other forms of anthropogenic disturbance (settlement construction, trail clearing, burning for game management). These activities create disturbed ground that wild Amaranthaceae colonise without deliberate planting. The geographic concentration in the EAC heartland (40--44°N) and temporal concordance with documented EAC domestication (3,000--2,000 BP) strengthen the cultivation interpretation, but non-cultivation anthropogenic disturbance remains a viable alternative for some portion of the signal. The 38.7% rate should be interpreted as a maximum estimate of cultivation-consistent sites; the true cultivation rate may be lower.
Baseline definition. The 3,000 BP baseline for ENA and 5,500 BP baseline for Europe embed archaeological assumptions about when agriculture began. If agricultural activity predates these cutoffs, baselines may be contaminated. The sensitivity analysis using a >5,000 BP baseline for ENA (confirming 0% exceedance in the 5,000--3,000 BP window) mitigates this concern.
4.8 Recommended multi-domain detection protocol
Based on the three-domain framework and the empirical results presented here, we recommend the following protocol for pollen-based agricultural impact detection:
-
Identify the regional agricultural tradition from archaeological and ethnobotanical evidence. Determine which transformation domain (A, B, C, or combination) is expected.
-
Select indicator sets for all three domains. Do not restrict analysis to a single indicator set. At minimum, test:
- Type A: AP/NAP ratio and/or pastoral indicator exceedance
- Type B: Crop-family exceedance with regionally appropriate taxa
- Type C: Individual tree taxon exceedance with ecological grouping (fire-promoted vs. fire-suppressed vs. climate-sensitive)
-
Apply consistent exceedance framework. Use pre-agricultural baseline mean + 2 SD for all indicator sets. Report the baseline period and its archaeological justification.
-
Calculate the indicator dependency gap. Report the range of detection rates across indicator sets. A large gap signals framework-system mismatch.
-
Apply disturbance discrimination. For each indicator set showing exceedance, test co-exceedance with a known natural-disturbance taxon (the "Artemisia analogue" for each region) to exclude non-anthropogenic forcing.
-
Cross-validate archaeologically. Compare exceedance timing and geography with independent archaeological databases.
-
Report limitations explicitly. State which transformation domains were not tested and what indicator dependency gap this produces.
-
For cross-cultural comparisons, require that all regions be tested with region-specific indicators before concluding that one region shows more or less agricultural impact than another. A comparison of European detection rates (obtained with European indicators) against non-European detection rates (also obtained with European indicators) is not a valid cross-cultural comparison --- it is a comparison of framework fit.
5. Conclusions
-
Agricultural impact detection via pollen is indicator-dependent, and this dependency is quantifiable. At 111 eastern North American sites, the detection rate ranges from 0% (European pastoral indicators) to 93.8% (tree taxa) depending solely on indicator choice. The indicator dependency gap --- 93.8 percentage points --- is the largest possible for a binary classification and demonstrates that detection outcome and indicator selection cannot be separated.
-
We introduce a three-domain framework decomposing agricultural transformation into structural change (Type A), crop-specific change (Type B), and compositional change (Type C). Different agricultural systems produce different domain profiles: European Neolithic agriculture manifests primarily as Type A, the Eastern Agricultural Complex as Type B, and indigenous fire management as Type C. Single-domain detection frameworks systematically miss transformations occurring in untested domains.
-
Region-specific reparameterisation recovers invisible signals. European indicators detect 0% at ENA sites; indigenous crop indicators (Amaranthaceae) detect 38.7% at the same sites, with 0% false positives before 3,000 BP, geographic concentration in the EAC heartland, Artemisia exclusion of natural disturbance (94.4%), and archaeological cross-validation (5/7 within 50 km). The signal is invisible under the European framework and detectable under the region-specific framework.
-
Global syntheses using uniform European-derived frameworks risk systematic underdetection of non-European agricultural systems. The EAC case demonstrates that an independently documented centre of plant domestication registers zero signal under the most commonly applied indicator framework. Similar blind spots plausibly exist for African, Southeast Asian, and Amazonian agricultural systems. Cross-cultural comparisons of agricultural impact must use region-specific indicators or report the indicator dependency gap.
-
A proxy framework detects only those transformations that alter its measured domain at its taxonomic resolution; all other transformations are structurally unidentifiable regardless of their ecological magnitude. Pollen records are not observations of past landscapes; they are projections of those landscapes through indicator frameworks with domain-specific sensitivities. This constraint is not arbitrary but structured: its magnitude is measurable (the indicator dependency gap), its direction is predictable (from the domain profile of the agricultural system), and its consequences are quantifiable (the misclassification rate). Recognising this transforms the question from "did agriculture impact this landscape?" to "which domains of transformation does this framework render identifiable?" The central implication is not that pollen records are unreliable, but that they are selective: they reveal only those dimensions of human–environment interaction that their indicator frameworks are designed to detect.
Acknowledgements
Pollen data were obtained from the Neotoma Paleoecology Database (https://www.neotomadb.org/). Radiocarbon data were obtained from the p3k14c database (Bird et al., 2022). We thank the data contributors whose records made this analysis possible. We are indebted to K.K. McLauchlan, whose 2003 study provided the precedent for indigenous crop pollen detection, and to N.G. Mueller, whose work on the Eastern Agricultural Complex motivated the indicator reparameterisation approach.
Data Availability
All pollen and surface sample data are publicly available through the Neotoma Paleoecology Database. Radiocarbon data are available from the p3k14c database (https://github.com/people3k/p3k14c). R scripts for all analyses are provided as Supplementary Material.
References
Abrams, M.D. & Nowacki, G.J. (2008). Native Americans as active and passive promoters of mast and fruit trees in the eastern USA. The Holocene, 18, 1123--1137.
Behre, K.-E. (1981). The interpretation of anthropogenic indicators in pollen diagrams. Pollen et Spores, 23, 225--245.
Bird, D., Miranda, L., Vander Linden, M., Robinson, E., Bocinsky, R.K., Nicholson, C., Capriles, J.M., Gayo, E.M., Gillings, M., Murray, J., Paulsen, C., Nores, N., Prates, L., Timmermann, A. & Freeman, J. (2022). p3k14c, a synthetic global database of archaeological radiocarbon dates. Scientific Data, 9, 27.
Chevalier, M., Cheddadi, R. & Chase, B.M. (2020). A critical assessment of human-impact indices based on anthropogenic pollen indicators. Quaternary Science Reviews, 236, 106291.
Davis, M.B. (1963). On the theory of pollen analysis. American Journal of Science, 261, 897--912.
Ellis, E.C., Gauthier, N., Klein Goldewijk, K., Bliege Bird, R., Boivin, N., Diaz, S., Fuller, D.Q., Gill, J.L., Kaplan, J.O., Kingston, N., Locke, H., McMichael, C.N.H., Ranco, D. et al. (2021). People have shaped most of terrestrial nature for at least 12,000 years. Proceedings of the National Academy of Sciences, 118, e2023483118.
Fritz, G.J. (2019). Feeding Cahokia: Early Agriculture in the North American Heartland. University of Alabama Press.
Fyfe, R.M., Woodbridge, J. & Roberts, N. (2015). From forest to farmland: pollen-inferred land cover change across Europe using the pseudobiomization approach. Global Change Biology, 21, 1197--1212.
Gaillard, M.J., Sugita, S., Mazier, F., Trondman, A.K., Brostrom, A., Hickler, T., Kaplan, J.O., Kjellstrom, E., Kokfelt, U., Kunes, P. et al. (2010). Holocene land-cover reconstructions for studies on land cover-climate feedbacks. Climate of the Past, 6, 483--499.
Gordon, J., Woodbridge, J., Sherrin, J. & Sherrin, F. (2024). Signal phase detection in pollen records using Bray-Curtis dissimilarity. Quaternary Science Reviews, 326, 108484.
Gordon, J., Woodbridge, J. & Sherrin, F. (2025). Increased Holocene diversity in Europe linked to human-associated vegetation change. Global Ecology and Biogeography, 34, e70166.
Gordon, J. et al. (2026a). Pastoral indicator exceedance, not first appearance, distinguishes anthropogenic from natural pollen signals: evidence from 331 sites in northwestern and central Europe. Quaternary Science Reviews [companion paper].
Gordon, J. et al. (2026b). Multi-site pollen evidence for pre-maize cultivation: Amaranthaceae exceedance in the Eastern Agricultural Complex heartland. The Holocene [companion paper].
Hunt, C.O. & Rushworth, G. (2005). Pollen taphonomy and airborne pollen deposition in a tropical rain forest, Sarawak, Malaysian Borneo. Journal of Biogeography, 32, 489--500.
Iversen, J. (1941). Land occupation in Denmark's Stone Age: a pollen-analytical study of the influence of farmer culture. Danmarks Geologiske Undersøgelse, II/66, 1--68.
Levis, C., Costa, F.R., Bongers, F., Pena-Claros, M., Clement, C.R., Junqueira, A.B., Neves, E.G., Tamanaha, E.K., Figueiredo, F.O., Salomao, R.P. et al. (2017). Persistent effects of pre-Columbian plant domestication on Amazonian forest composition. Science, 355, 925--931.
Marquer, L., Gaillard, M.J., Sugita, S., Trondman, A.K., Mazier, F., Nielsen, A.B., Fyfe, R.M., Odgaard, B.V., Alenius, T., Birks, H.J.B. et al. (2017). Quantifying the effects of land use and climate on Holocene vegetation in Europe. Quaternary Science Reviews, 171, 20--37.
Matthias, I., Semmler, M.S. & Giesecke, T. (2015). Pollen diversity captures landscape structure and diversity. Journal of Ecology, 103, 880--890.
Mayle, F.E. & Iriarte, J. (2014). Integrated palaeoecology and archaeology: a powerful approach for understanding pre-Columbian Amazonia. Journal of Archaeological Method and Theory, 21, 161--181.
McLauchlan, K.K. (2003). Plant cultivation and forest clearance by prehistoric North Americans: pollen evidence from Fort Ancient, Ohio, USA. The Holocene, 13, 557--566.
Mercuri, A.M., Bandini Mazzanti, M., Florenzano, A., Montecchi, M.C. & Rattighieri, E. (2013). Olea, Juglans and Castanea: the OJC group as pollen indicators of the cultural landscape. Annali di Botanica, 3, 143--153.
Mottl, O., Flantua, S.G.A., Bhatt, K.P., Felde, V.A., Giesecke, T., Goring, S., Grimm, E.C., Haberle, S., Hooghiemstra, H., Ivory, S. et al. (2021). Global acceleration in rates of vegetation change over the past 18,000 years. Science, 372, 860--864.
Mueller, N.G. (2017). Mound Centers and Seed Security: A Comparative Analysis of Botanical Assemblages from Middle Woodland Sites in the Lower Illinois Valley. Springer.
Mueller, N.G. (2025). Lost crops of the Eastern Woodlands: new perspectives on old questions. Annual Review of Anthropology, 54.
Neumann, K. (2005). The romance of farming: plant cultivation and domestication in Africa. In: Stahl, A.B. (ed.) African Archaeology: A Critical Introduction. Blackwell, pp. 249--275.
Nogué, S., Rull, V. & Nascimento, L. (2025). Anthropogenic pollen indicators and their use in quantifying human land use. Quaternary Science Reviews, 328, 108543.
Roberts, N., Fyfe, R.M., Woodbridge, J., Gaillard, M.J., Davis, B.A.S., Kaplan, J.O., Marquer, L., Mazier, F., Nielsen, A.B., Sugita, S. et al. (2018). Europe's lost forests: a pollen-based synthesis for the last 11,000 years. Scientific Reports, 8, 716.
Ruddiman, W.F. (2003). The anthropogenic greenhouse era began thousands of years ago. Climatic Change, 61, 261--293.
Smith, B.D. (2006). Eastern North America as an independent center of plant domestication. Proceedings of the National Academy of Sciences, 103, 12223--12228.
Stephens, L., Fuller, D., Boivin, N., Rick, T., Gauthier, N., Kay, A., Marwick, B., Armstrong, C.G., Barton, C.M., Denham, T. et al. (2019). Archaeological assessment reveals Earth's early transformation through land use. Science, 365, 897--902.
Sugita, S. (2007). Theory of quantitative reconstruction of vegetation I: pollen from large sites REVEALS regional vegetation composition. The Holocene, 17, 229--241.
Turner, J. (1962). The Tilia decline: an anthropogenic interpretation. New Phytologist, 61, 328--341.
VanDerwarker, A.M., Bardolph, D.N., Hoppa, K.M., Thakar, H.B., Martin, L.S., Jaqua, A.L., Biwer, M.E. & Gill, K.M. (2017). New World paleoethnobotany in the new millennium (2000--2013). Journal of Archaeological Research, 25, 305--358.
Veeken, A., Aelst, P., Lupo, K.D. & Marquer, L. (2022). Pollen-based reconstruction reveals the impact of the onset of agriculture on plant functional trait composition. Ecology Letters, 25, 1937--1951.
Whitney, B.S., Rushton, E.A.C., Carson, J.F., Iriarte, J. & Mayle, F.E. (2012). An improved methodology for the recovery of Zea mays and other large crop pollen, with implications for environmental archaeology in the Neotropics. The Holocene, 22, 1087--1096.
Williams, J.W., Grimm, E.C., Blois, J.L., Charles, D.F., Davis, E.B., Goring, S.J., Graham, R.W., Smith, A.J., Anderson, M., Arroyo-Cabrales, J. et al. (2018). The Neotoma Paleoecology Database, a multiproxy, international, community-curated data resource. Quaternary Research, 89, 156--177.